


Next: 4.4.1 A Note About
Up: 4. Using Frequencies for
Previous: 4.3.1 Assumptions and Conventions
4.4 Distance
We need a way of
comparing two equal-sized tables for ``similarity'' or ``closeness''. Suppose you
wish to compare the Genesis and Romeo and Juliet frequencies. As shown
in Figure 21, a first step is to subtract the frequencies for each character.
Figure 21:
Unigram Differences and Magnitudes of Differences
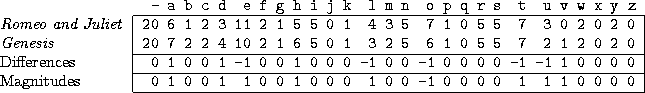 |
Since the
sign (positive or negative) of the differences have nothing to do
with how big
the differences are, take the absolute value of each difference to
get its magnitude. The last row shows the magnitude of each
difference. (The differences do not quite jibe with the original
frequencies because of rounding.)
The list of magnitudes gives us an idea of closeness, but it is
cumbersome to deal with so much data. With bigrams, the tediousness
would be even worse. Therefore, we would like to combine the
magnitudes into a single number that measures the distance
between two equal-sized tables. There are many possibilities of what
function to use for distance, usually all based on the magnitudes of
the differences between corresponding elements. For
example,5
- Maximum or
 distance: maximum magnitude
- L2 distance: square root of the sum of the squares of the magnitudes
- Manhattan or taxicab or L1 distance: sum of the magnitudes
For simplicity, choose the last one, the L1 distance d. Why?
It's simple and, as you will discover, tends to work. To compute
d, pick two unigram or bigram tables with frequencies you wish to
compare. Let N be the size of the character set, including a
space. The values may contain either percentages or tallies, but both
tables must have the same type of frequency! Take each absolute value
of the difference between each element from the pair of tables and add
all differences together:
Your choice of table1 and table2 is irrelevant because of the absolute
value. Index i ranges over all rows 1..N; index j
ranges over all columns 1..N.
One question that we must answer is, what distances count as ``close''?
Next: 4.4.1 A Note About
Up: 4. Using Frequencies for
Previous: 4.3.1 Assumptions and Conventions
Thomas Yan
2000-05-01