


Next: 3.5 Bigram Frequencies
Up: 3. Foundation for Cracking:
Previous: 3.3 Example
You may collect unigram frequencies in tables using either tallies or
percentages. From Figure 10, count the number of times '-', 'a', 'b', 'c', and
'd' each appear. Each character count produces a tally, tabulated in Figure 11.
Compute each character's frequency as a ratio of the number of times that
character appears and the total number of characters. You may tabulate the
frequencies as ratios, as shown in Figure 12. These tables are called
unigram tables.
Figure 11:
Unigram Frequencies (Tallies)
 |
Figure 12:
Unigram Frequencies (Percentages (%))
 |
Although the tables might appear two dimensional, the numbers are in a single
row. So, think of the set of unigram frequencies as a 1-D table. Why two tables
for each table of unigram frequencies? You may choose to count characters in
any order, so the tables in each pair are equivalent. However, note that the
count and percent frequencies differ! To access a frequency for a particular
character, use the notation
 ,
where j is any character from the character set,
including '-'. For example,
,
where j is any character from the character set,
including '-'. For example,
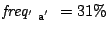 tells you that 'a' occurs 31% of the time.
Next: 3.5 Bigram Frequencies
Up: 3. Foundation for Cracking:
Previous: 3.3 Example
Thomas Yan
2000-05-01